Show Store Sales
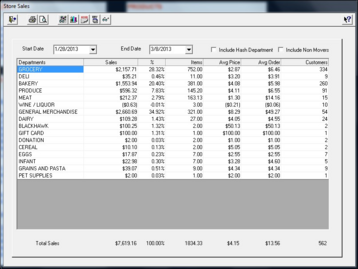
The Show Store Sales form displays or prints information about store sales volume by department.
Each line item displays department sales dollars and percent of total store sales, the number of items in the department category, average price of the products in the department, the average number of items per order, and the number of customers purchasing the products in the department.
To review your Store’s sales:
- Select Show Store Sales from the Point of Sales Icon. The screen defaults to the current day sales.
- Enter the Start Date and End DateStart_DateEnd_Date for the period of time you wish to review.
- Click the Include Hash DepartmentInclude_Hash_Department to view sales including Departments flagged as Hash Departments. These are departments that are not normally counted as store sales, for example Postage Stamps.
- Click Include Non MoversInclude_Non_Movers to view sales for all Departments regardless if the department has sales for the criteria selected.
Store Sales are calculated as follows:
- Department SalesDepartment_Sales_Calculation
- Section SalesSection_Sales_Calculation
- PercentPercent_of_Store_Sales
- ItemsItems
- Average PriceAverage_Price
- Average OrderAverage_Order
- CustomersCustomers_1
Tips: To view sales by Section click on the View Sections button in the toolbar. View Sales by Section is calculated up to the time of the last Store Close.
Click the Graph Sale button in the toolbar to see sales in a graph. Sales can be graphed by the week, by the month and by the year.
Use the View Taxes from the Toolbar to view taxable sales by department and the corresponding sales taxes collected from those sales. Use the Print Report button to print the Store Sales Taxes Report.
Use the Aggregate Sales Report to displays sales by Aggregated Departments. Aggregate Departments are set up in the Department Maintenance task.